In this tutorial, we’ll show you how to customize a report in Not Just Analytics.
A well-structured, customized report allows you to:
- adapt it to your specific needs by selecting the most relevant charts.
- add comments to make the data easier to understand.
- insert images and screenshots to support your insights.
- add your own logo for a professional finishing touch.
📌 The type of report and available features depend on your subscription plan. Some options may be limited based on your plan.
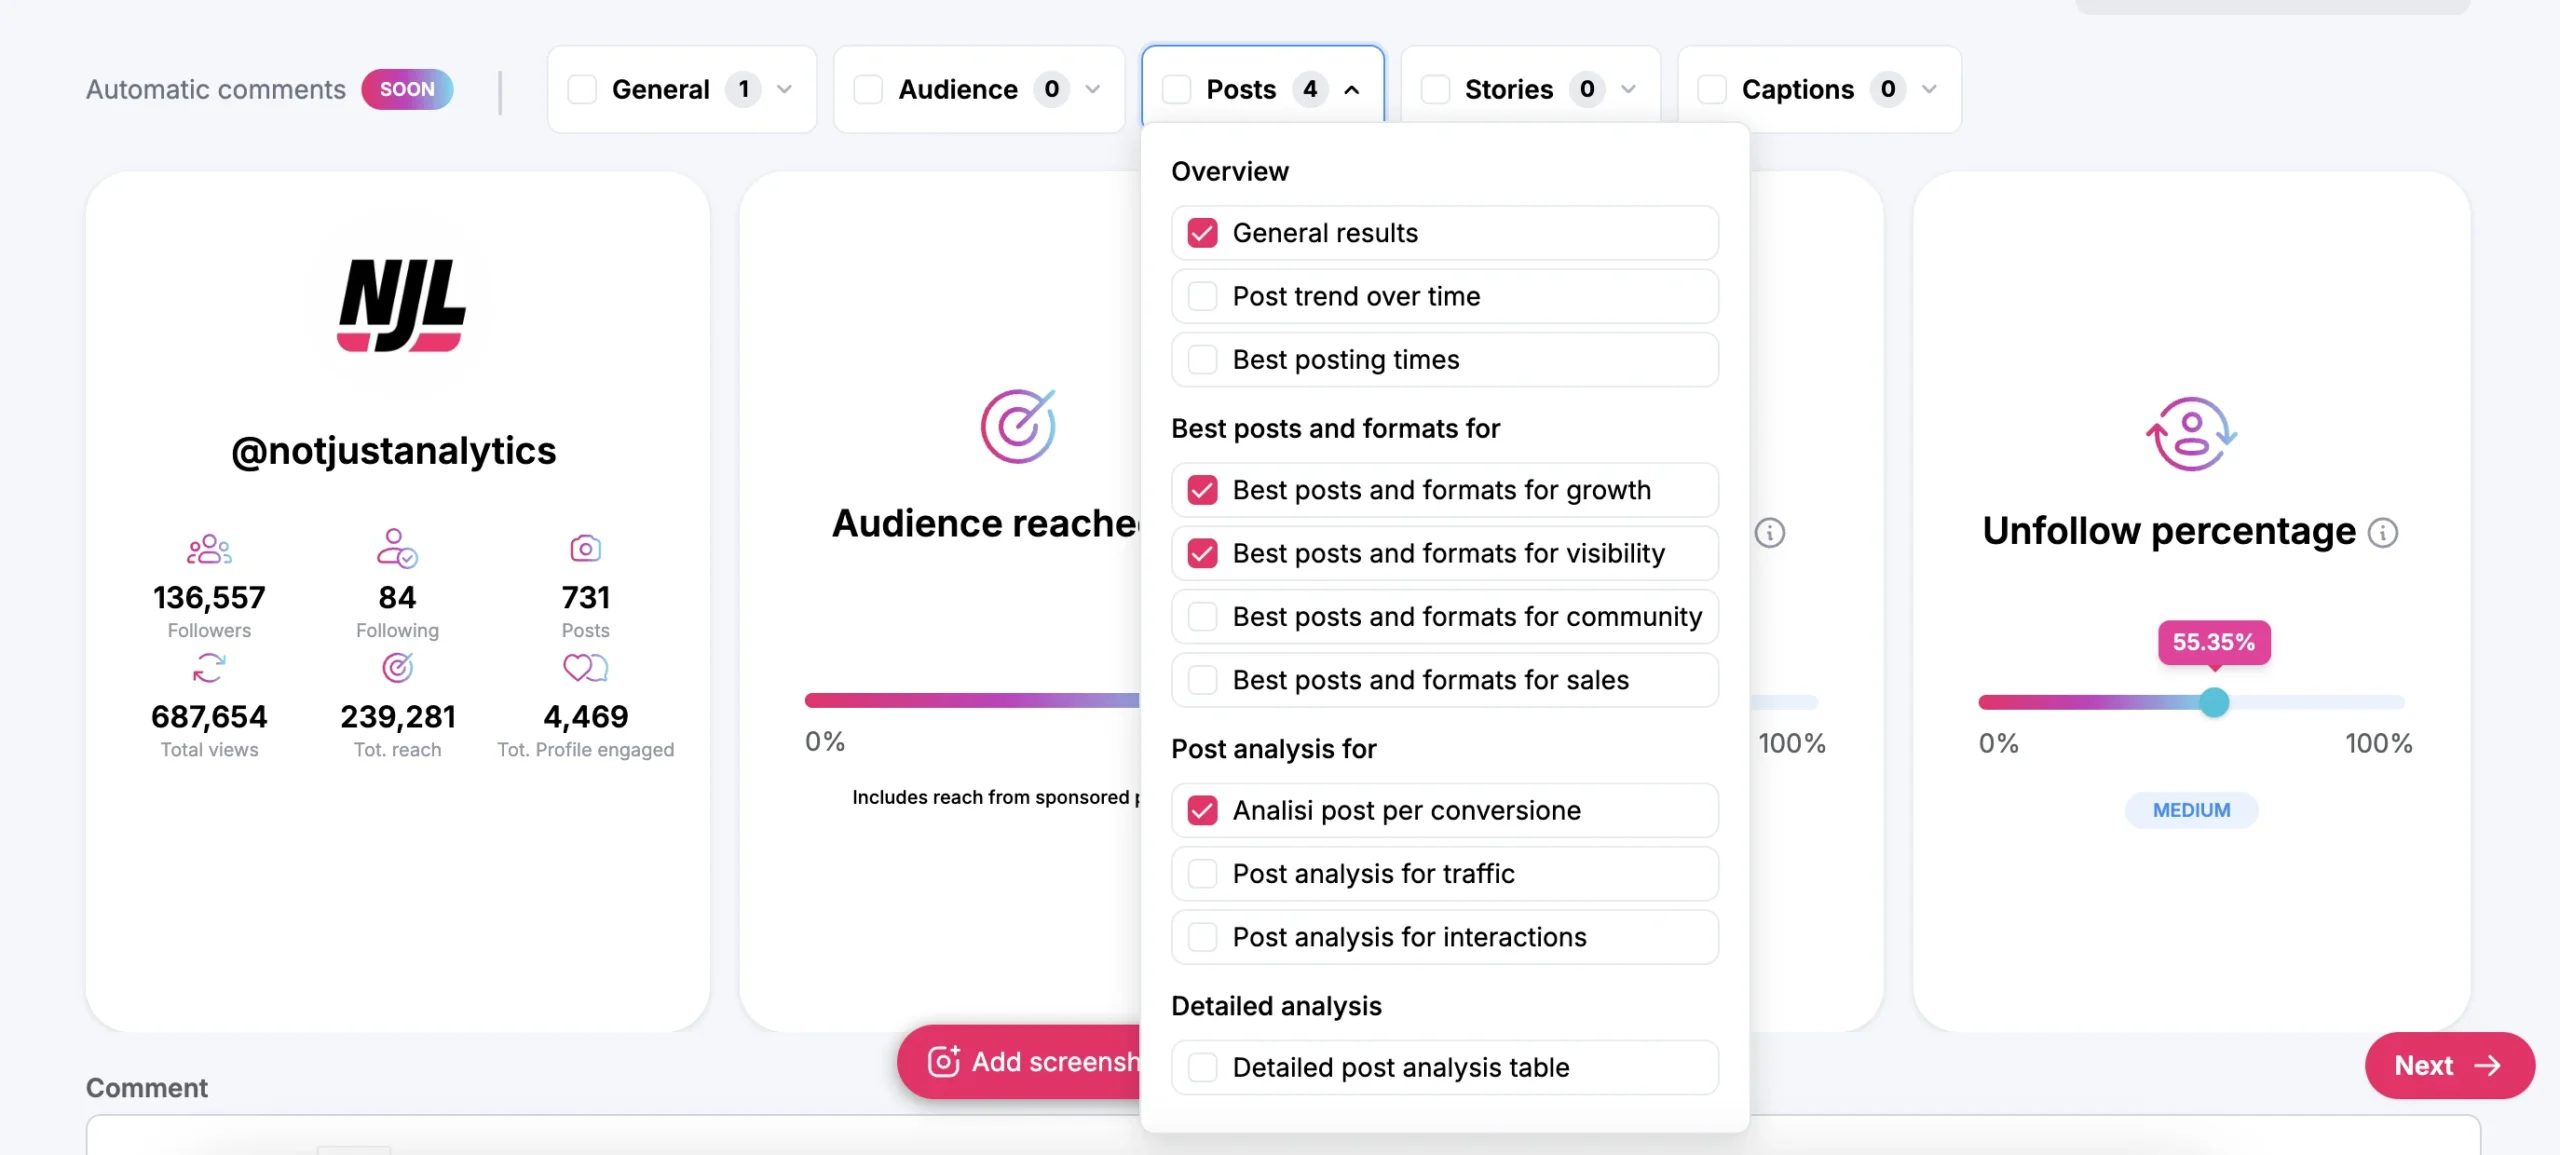
1️⃣ Selecting the charts to include
After you’ve begun creating a report and chosen the Instagram profile and date range, you can select the charts to include.
- Bulk selection: choose all sections with a single click.
- Custom selection: expand each section and pick only the specific charts you’re interested in. This option is useful if you want a more targeted report.
📌 Tip: If you want to create different reports for various teams or clients, customizing the sections will help you provide more detailed and tailored analysis!
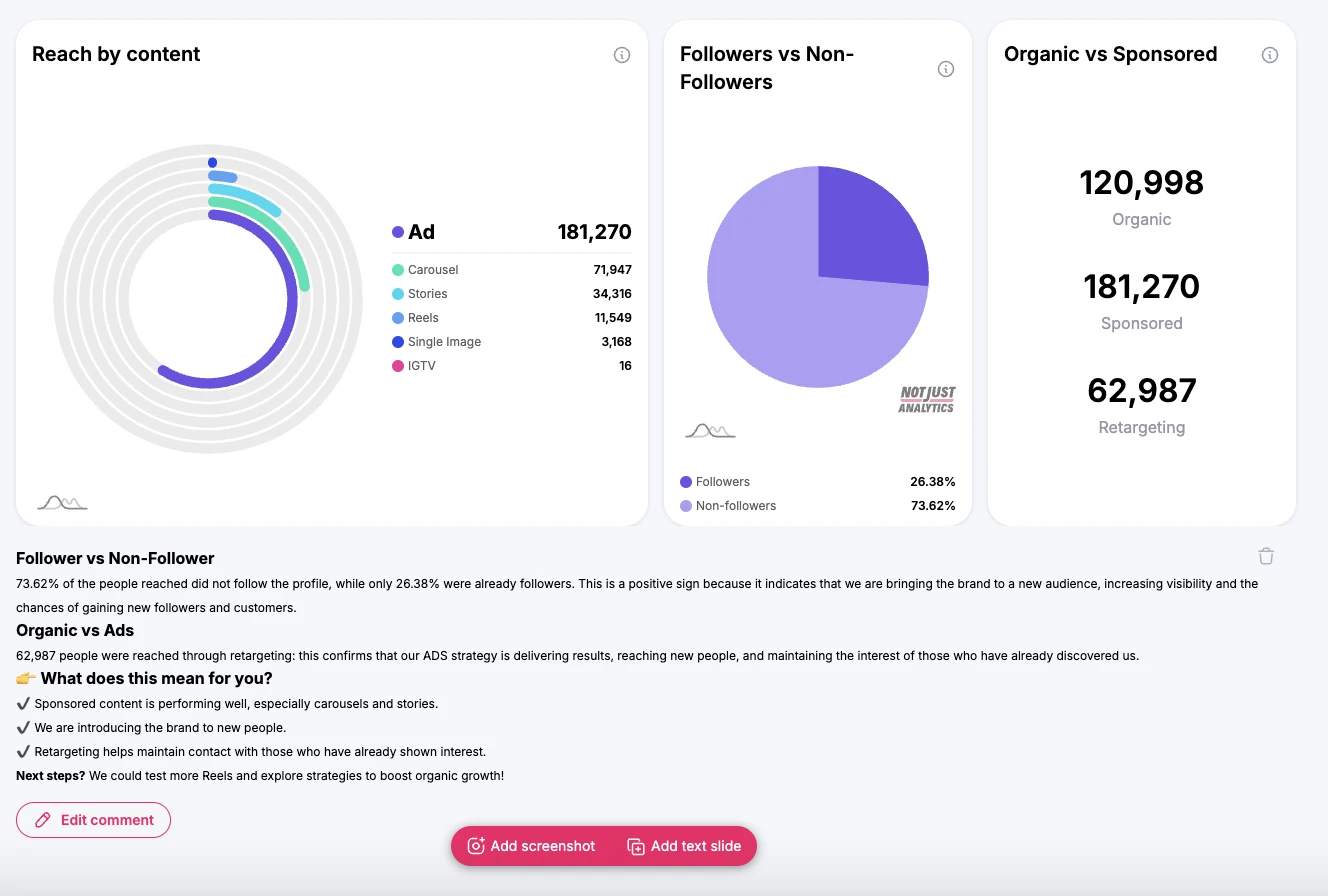
2️⃣ Adding comments to charts
You can enhance your report by adding custom comments under each chart.
- Type your comment in the dedicated field under the chart, and personalize it: insert links, bullet points, numbered lists, titles, etc.
- After writing the comment, click ’Add comment’ to save it.
- To edit an existing comment: click ‘Edit’, make your changes, then click ‘Save changes’ once done.
📌 Tip: use comments to highlight important insights and make the report clearer for whoever receives it!
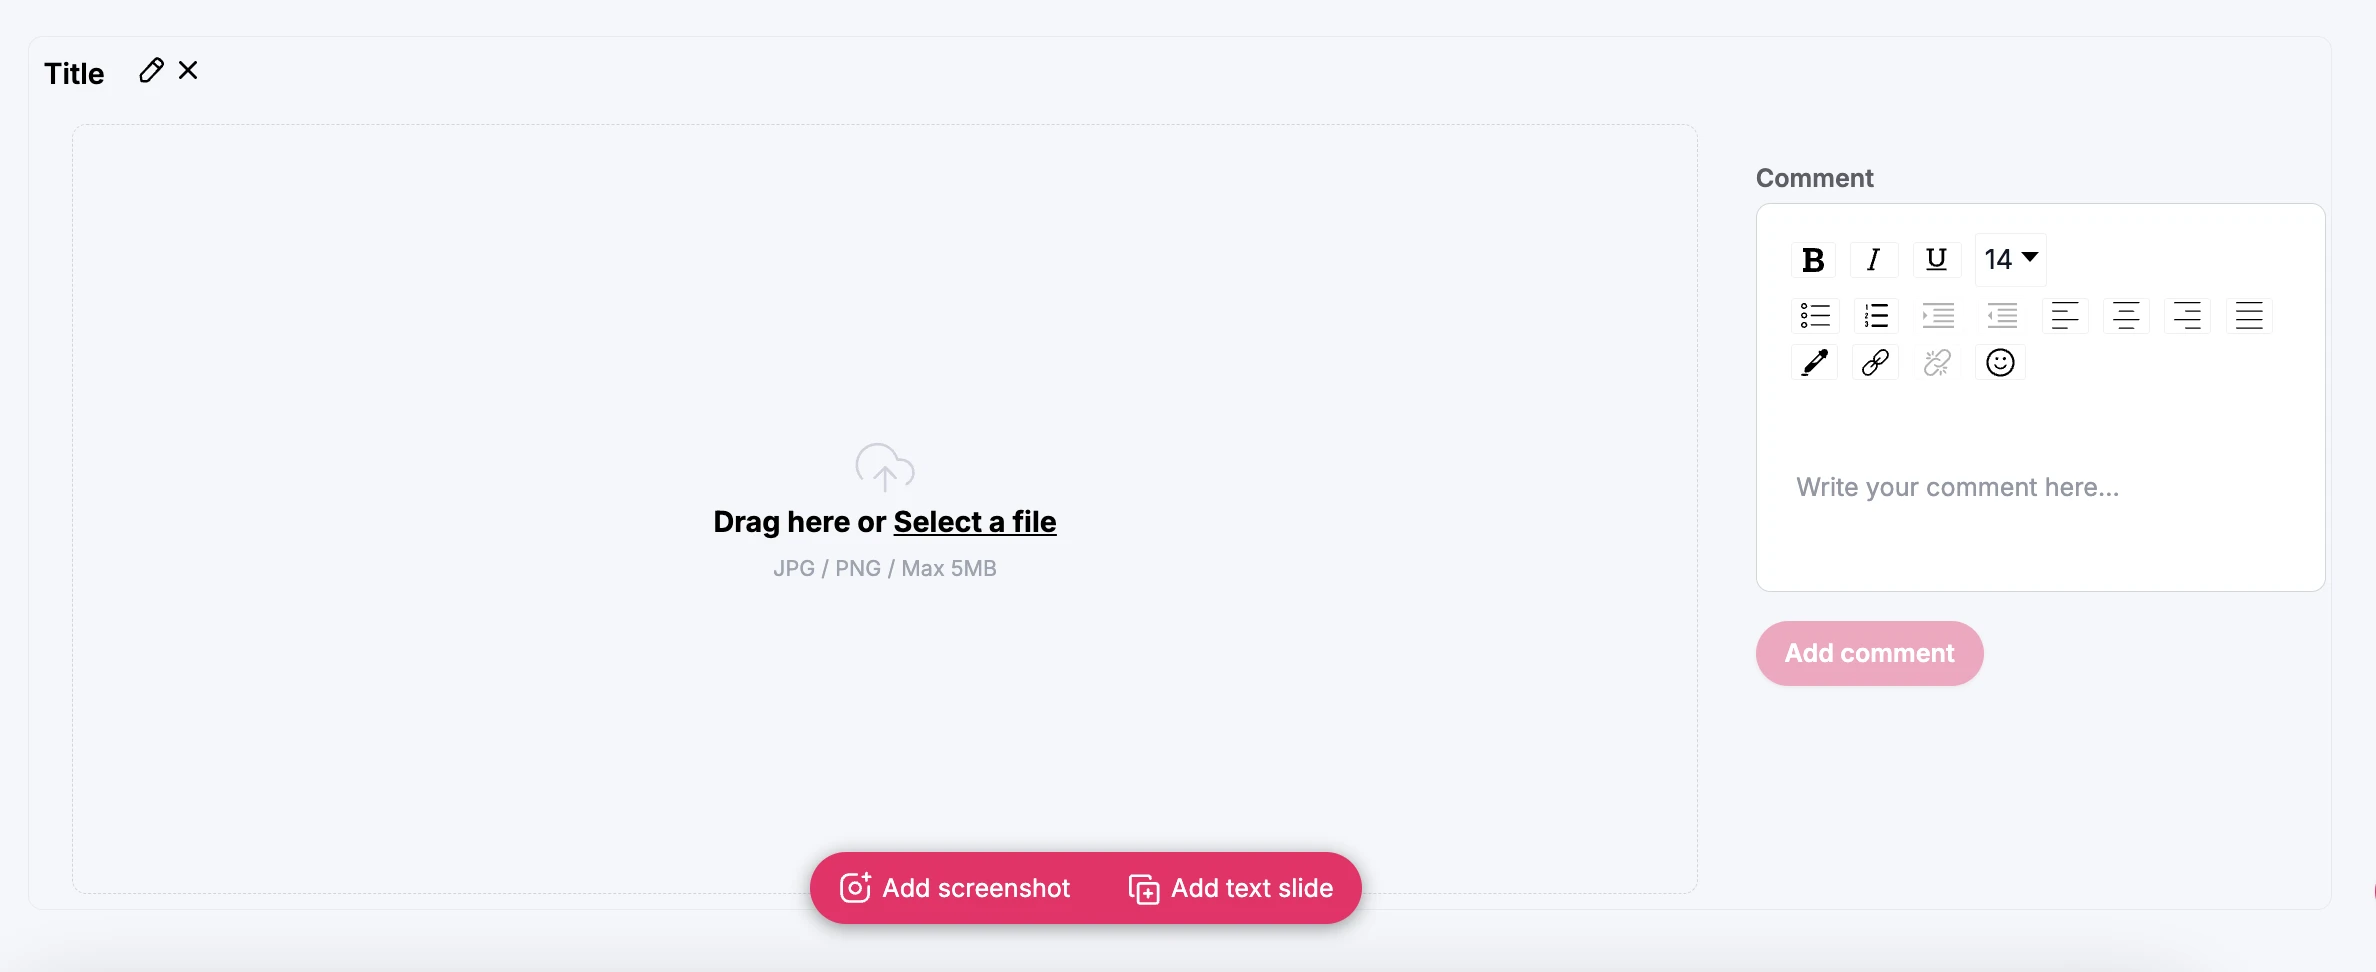
3️⃣ Adding text slides
In addition to chart comments, you can also add standalone text slides to the report.
- Add a new slide and give it a title.
- Write the slide text, including any explanations or detailed info.
- Click ’Save’ to confirm.
📌 Difference between comments and text slides:
- Comments appear under the charts.
- Text slides appear as separate pages in the report.
💡 Use text slides to:
✅ Add an introduction or conclusion to the report.
✅ Provide detailed analysis of the metrics.
✅ Include a strategy or action plan based on the data.
4️⃣ Adding images to the report
If you want to enrich your report with external data, you can upload images from other sources, such as screenshots from Google Analytics, Facebook, or other tools.
- Drag the image into the dedicated slide or upload it from your device.
- Add a comment to the image to provide context.
- Click ’Save and add comment’ to confirm.
📌 Tip: Use this feature to include external analyses or compare data from different platforms.
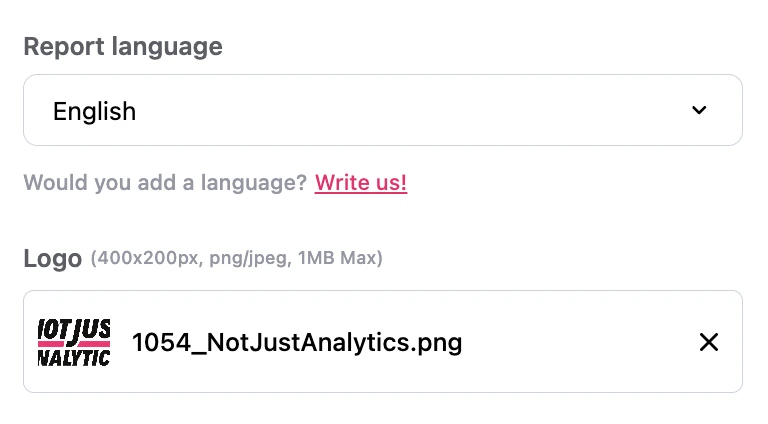
5️⃣ Adding a logo to the report
To make your report more professional and personalized, you can add your company logo (or your client’s).
- Go to the ’Logo’ section within the report customization.
- Upload the logo by selecting a file from your device.
- The logo will be automatically included in all future reports, but you can change it before generating a new report.
📌 Why add a logo? It makes the report more recognizable for clients and collaborators and adds a professional touch to your data presentation!
6️⃣ Finalizing the report
After customizing the report with charts, comments, text slides, images, and a logo, you’re ready to generate it!
- Save all changes (comments, text slides, images, and logo).
- Click ’Create Report’ to finalize the process.
📌 Note: If the report contains a lot of data, it may take a few minutes to generate. Once it’s ready, you’ll find it in the Report History.
Conclusion
Customizing a report in Not Just Analytics lets you create a clear, structured document—perfect for presenting data to your clients, your team, or for your personal analysis.
📌 In summary, you can:
✅ select the charts most relevant to your report.
✅ add custom comments to explain the data.
✅ create text slides for deeper analysis.
✅ upload external images to include additional insights.
✅ insert your logo for a professional touch.
💡 Need help?
If some features aren’t available, it might be due to your subscription plan. Check out the features included in each plan or contact our support team for more details.